TSUNAMI INFOGRAPHICS
For today’s blog, it is all about disaster preparedness and spreading awareness to all people, especially when there is too much risk in their homes near bay. Wikipedia tells us that “Information graphics or infographics that are visual representations of information, data or knowledge. These graphics are used where complex information needs to be explained quickly and clearly, such as in signs, maps, journalism, technical writing, and education. They are also used extensively as tools by computer scientists, mathematicians, and statisticians to ease the process of developing and communicating conceptual information.” But more clearly they can be described as the amazing drawings newspapers and magazines use to lure in readers.
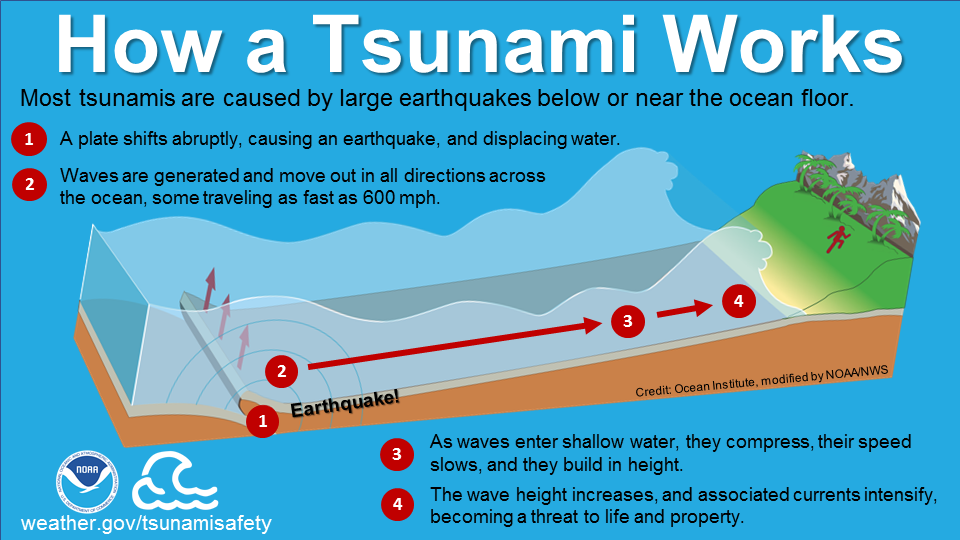
What Causes A Tsunami

How A Tsunami Wave Forms


How High Is A Tsunami Wave